ここでは,農業協同組合の部門別損益の把握を試みます。
まず,最新の総合農協統計表の損益計算書の統計データがどこにあるかを確認します。
e-Statには部門別損益のデータセットも用意されており,次のページから確認できます。
部門別損益の表は,損益計算書を組み替えたものだと考えられます。 しかしながら,各統計表の数値は一致しません。 例えば,事業総利益は前者では1,681,282,800,後者では1,679,196,457となっている(単位はいずれも千円)。 本来,これらの数値は一致するはずであることから,どちらかが再集計しているのかもしれません。
上記2つのデータセットを提供するページのいずれにもExcelファイルはありません。 どこかにExcelファイルを提供するページはあるでしょうか。 探すと,次の2つのページが見つかりました。
これらのページで提供されるExcelファイルはデータベースとして提供される情報よりも新しいようである。 e-StatからAPIでデータを入手する場合,同じデータを含むExcelファイルを確認するとよさそうです。
ここでは,最新データにこだわる必要はないため,扱いやすいデータベースのデータセット(部門別損益)を用いて図を作成することにします。
e-Statからデータ取得
早速,次のコードを実行しよう。 次のコードにある statsDataId = "0002063277" の数字はアクセスしたい統計データのIDです。
library (httr)<- "../fig" dir.create (outdir, showWarnings = FALSE )<- keyring:: key_get ("e-stat" )<- "0002063277" <- httr:: GET (url = "https://api.e-stat.go.jp/rest/2.1/app/getSimpleStatsData" ,query = list (appId = appId,statsDataId = statsDataId,sectionHeaderFlg = 2 <- httr:: content (response)<- read.csv (text = sub ("^.* \\\" VALUE \\\"\n " , "" , response), header = TRUE , check.names = FALSE )head (df, 10 )
   cat01_code (NOUKYOU1-21-2-011)部門別損益計算書(総括版)_区分 cat02_code
1        1001                                           事業収益       1001
2        1001                                           事業収益       1002
3        1001                                           事業収益       1003
4        1001                                           事業収益       1004
5        1001                                           事業収益       1005
6        1001                                           事業収益       1006
7        1001                                           事業収益       1007
8        1002                                           事業費用       1001
9        1002                                           事業費用       1002
10       1002                                           事業費用       1003
   (NOUKYOU1-21-1-081)部門別損益計算書(総括版) unit      value
1                                             計 千円 4329374971
2                                       信用事業 千円  822331558
3                                       共済事業 千円  441474100
4                                   農業関連事業 千円 2235760362
5                                 生活その他事業 千円  798150731
6                                   営農指導事業 千円   31659070
7                                   共通管理費等 千円          -
8                                             計 千円 2650178394
9                                       信用事業 千円  123517003
10                                      共済事業 千円   25769005
<- "農業協同組合の部門別損益" :: datatable (caption = caption, rownames = TRUE ,extensions = 'Buttons' ,options = list (pageLength = 10 ,dom = 'Blfrtip' ,buttons = list (c ('csv' , 'excel' )|> :: formatCurrency (ncol (df), currency = "" , interval = 3 , mark = "," , digits = 0 )
棒グラフ
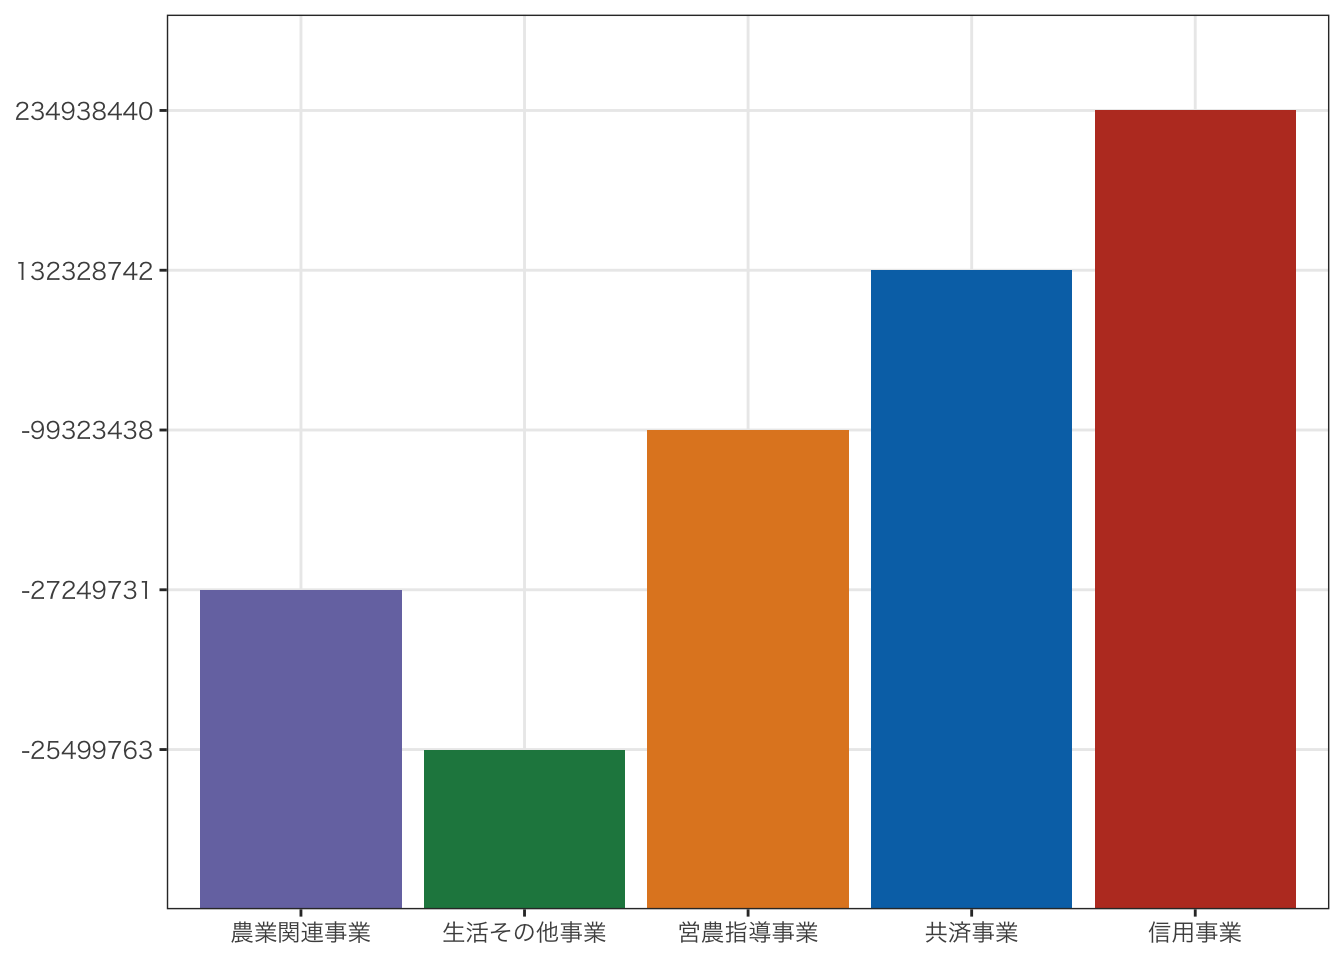
まず,税引前当期利益を比較してみよう。
<- df[df[, 2 ] == "税引前当期利益" & df$ ` (NOUKYOU1-21-1-081)部門別損益計算書(総括版) ` != "計" & df$ value != "-" , ]library (ggplot2)library (ggsci)<- ggplot (data = df1) + geom_bar (aes (x = ` (NOUKYOU1-21-1-081)部門別損益計算書(総括版) ` ,y = value,fill = ` (NOUKYOU1-21-1-081)部門別損益計算書(総括版) ` stat = "identity" + scale_x_discrete (limits = rev) + scale_fill_nejm () + theme_bw () + theme (legend.position = "none" ,axis.title = element_blank ()+ theme (text = element_text (family = "HiraKakuProN-W3" ))
R(RStudio)で実行(QuartoをRender)した場合とVisual Studio CodeでQuartoをRenderした場合とで,横軸の目盛りの順番が異なります。 後で実行する,levels(factor(df$(NOUKYOU1-21-1-081)部門別損益計算書(総括版)))の結果にも違いが生じます。 おそらく後者の処理の中でバグが生じている可能性が考えられます。 ここに表示されるものは後者でRenderした結果です。
縦軸の数値の幅がおかしいですね。 ここで,データフレームの構造を確認してみましょう。
'data.frame':   140 obs. of  6 variables:
 $ cat01_code                                        : int  1001 1001 1001 1001 1001 1001 1001 1002 1002 1002 ...
 $ (NOUKYOU1-21-2-011)部門別損益計算書(総括版)_区分: chr  "事業収益" "事業収益" "事業収益" "事業収益" ...
 $ cat02_code                                        : int  1001 1002 1003 1004 1005 1006 1007 1001 1002 1003 ...
 $ (NOUKYOU1-21-1-081)部門別損益計算書(総括版)     : chr  "計" "信用事業" "共済事業" "農業関連事業" ...
 $ unit                                              : chr  "千円" "千円" "千円" "千円" ...
 $ value                                             : chr  "4329374971" "822331558" "441474100" "2235760362" ...
value列が文字型となっているのは,"-"が入っているためであることが想像できます。 このため,"-"を削除してから,数値型に変換しましょう。 なお,後述のように estatapi パッケージを使うとこのような問題は発生しません。
$ value <- as.double (sub ("^-$" , "" , df$ value))levels (factor (df$ ` (NOUKYOU1-21-1-081)部門別損益計算書(総括版) ` ))
[1] "信用事業"       "共済事業"       "共通管理費等"   "営農指導事業"
[5] "生活その他事業" "計"             "農業関連事業"
$ ` (NOUKYOU1-21-1-081)部門別損益計算書(総括版) ` <- factor (df$ ` (NOUKYOU1-21-1-081)部門別損益計算書(総括版) ` , levels = unique (df$ ` (NOUKYOU1-21-1-081)部門別損益計算書(総括版) ` ))
上述のように実行環境によって結果が変わることから,ここではfactorのlevelsを明示している。 ここでlevelsを省略した場合,R(RStudio)とVisual Studio Codeの結果のいずれも正しくない。
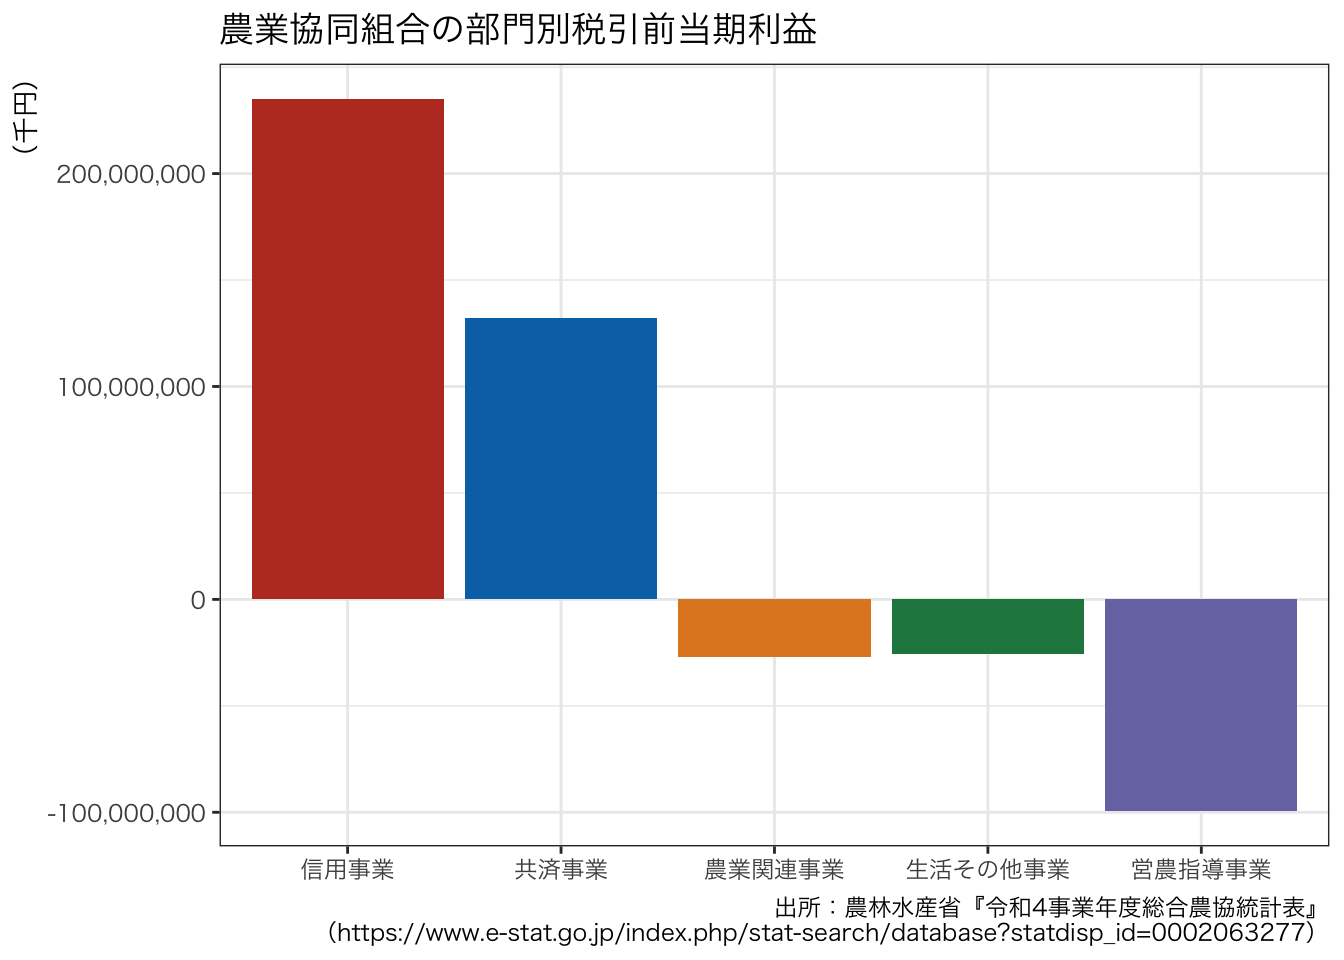
改めて,税引前当期利益を比較してみましょう。
library (stringr)<- df[str_detect (df$ ` (NOUKYOU1-21-2-011)部門別損益計算書(総括版)_区分 ` , "^税引前当期利益$" ) & ! str_detect (df$ ` (NOUKYOU1-21-1-081)部門別損益計算書(総括版) ` , "^(計|共通管理費等)$" ), ]<- ggplot (data = df1) + geom_bar (aes (x = ` (NOUKYOU1-21-1-081)部門別損益計算書(総括版) ` ,y = value,fill = ` (NOUKYOU1-21-1-081)部門別損益計算書(総括版) ` stat = "identity" + scale_y_continuous (labels = scales:: comma_format (), name = "(千円)" ) + scale_fill_nejm () + labs (title = "農業協同組合の部門別税引前当期利益" ,caption = "出所:農林水産省『令和4事業年度総合農協統計表』 \n (https://www.e-stat.go.jp/index.php/stat-search/database?statdisp_id=0002063277)" + theme_bw () + theme (legend.position = "none" ,axis.title.x = element_blank (),axis.title.y = element_text (size = 10 , hjust = 1 )+ theme (text = element_text (family = "HiraKakuProN-W3" ))
営農指導事業,生活その他事業,農業関連事業の税引前当期利益がマイナスであることが分かります。 これらについて詳細を確認するために,次に,事業総利益と事業管理費のグラフを描いてみましょう。
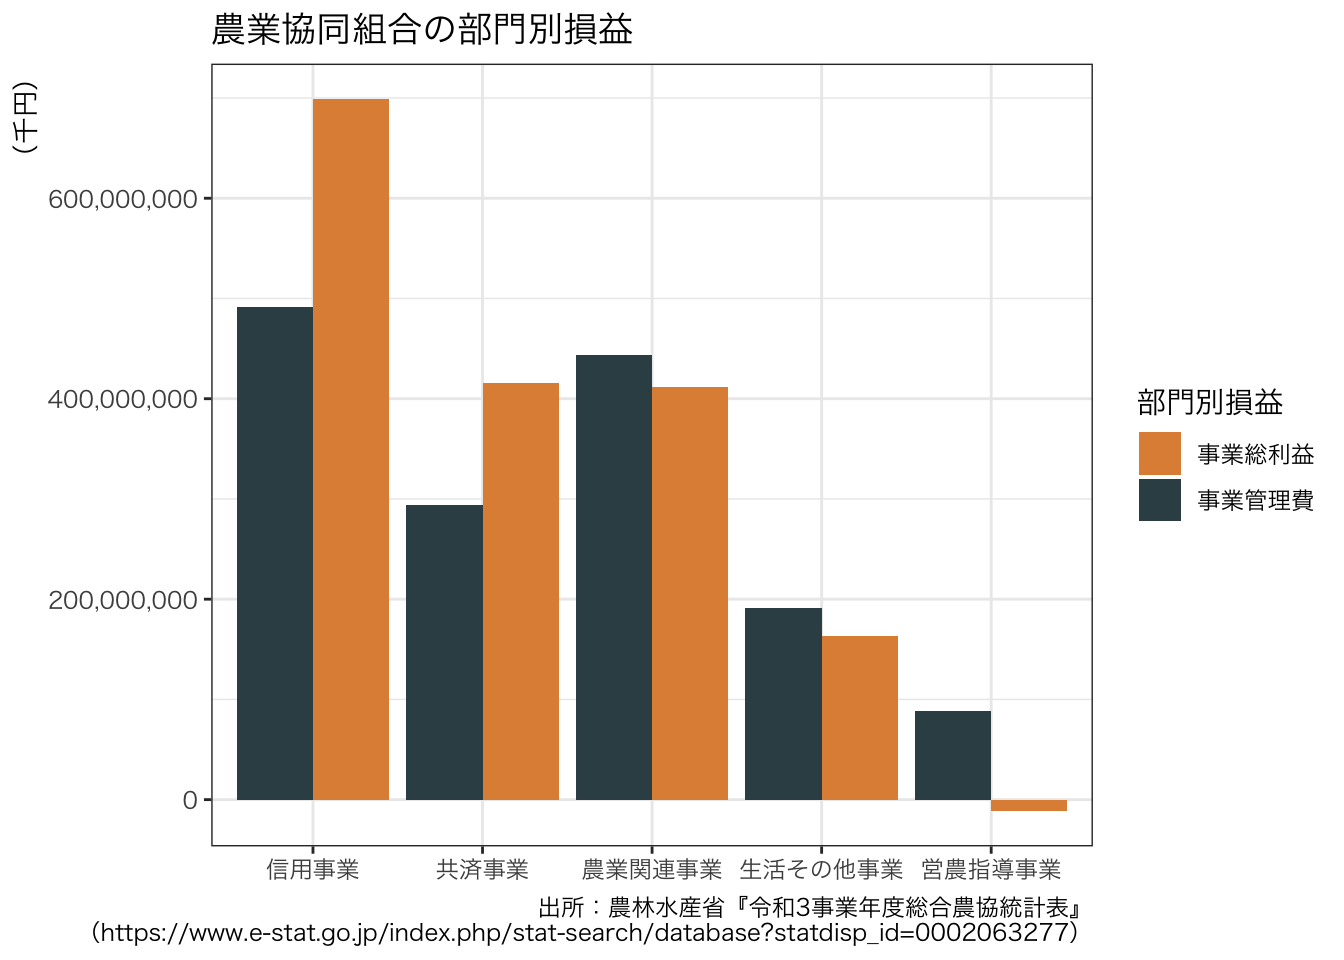
<- df[str_detect (df$ ` (NOUKYOU1-21-2-011)部門別損益計算書(総括版)_区分 ` , "^(事業総利益|事業管理費)$" ) & ! str_detect (df$ ` (NOUKYOU1-21-1-081)部門別損益計算書(総括版) ` , "^(計|共通管理費等)$" ), ]<- ggplot (data = df2) + geom_bar (aes (x = ` (NOUKYOU1-21-1-081)部門別損益計算書(総括版) ` ,y = value,fill = ` (NOUKYOU1-21-2-011)部門別損益計算書(総括版)_区分 ` stat = "identity" ,position = "dodge" + scale_y_continuous (labels = scales:: comma_format (), name = "(千円)" ) + scale_fill_jama () + guides (fill = guide_legend (reverse = TRUE , title = "部門別損益" )) + labs (title = "農業協同組合の部門別損益" ,caption = "出所:農林水産省『令和3事業年度総合農協統計表』 \n (https://www.e-stat.go.jp/index.php/stat-search/database?statdisp_id=0002063277)" + theme_bw () + theme (axis.title.x = element_blank (),axis.title.y = element_text (size = 10 , hjust = 1 )+ theme (text = element_text (family = "HiraKakuProN-W3" ))
ggsave (file = file.path (outdir, "profit_and_loss_by_division.pdf" ), plot = p, width = 8 , height = 4 )
営農指導事業は事業総利益そのものがマイナスの値を示していることが分かります。
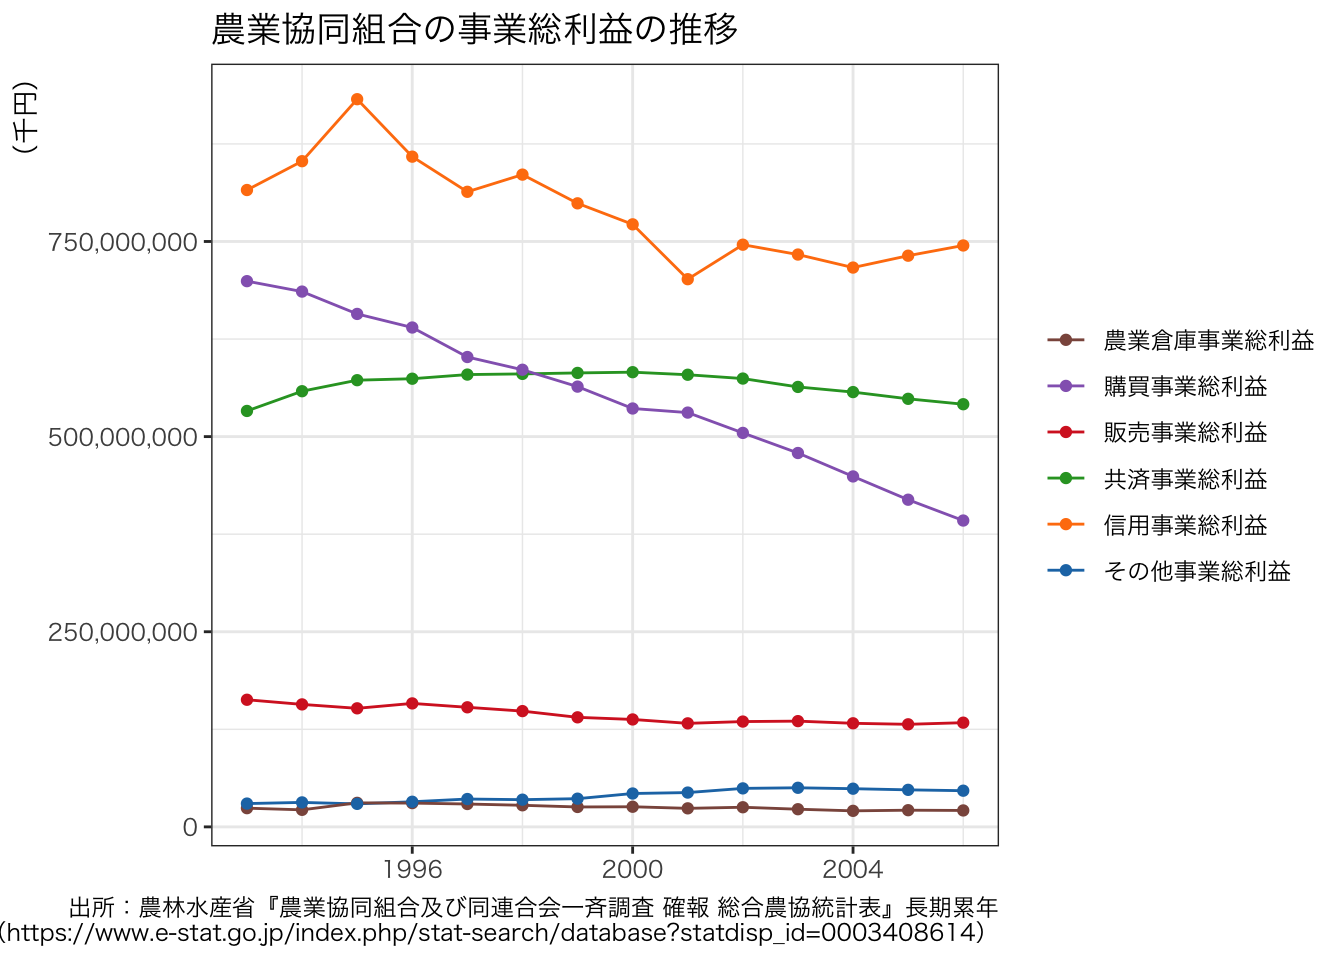
折れ線グラフ
次に,農業協同組合の部門別損益の推移の把握を試みます。 任意の値の推移を見る場合は,棒グラフより折れ線グラフの方が適しています。
農業協同組合の長期累年の統計データとして,損益計算書が提供されています。
このサービスは、政府統計総合窓口(e-Stat)のAPI機能を使用していますが、サービスの内容は国によって保証されたものではありません。
<- "0003408614" <- estat_getMetaInfo (appId = appId, statsDataId = statsDataId))
Warning: `update_list()` was deprecated in purrr 1.0.0.
ℹ The deprecated feature was likely used in the estatapi package.
  Please report the issue at
  <https://github.com/yutannihilation/estatapi/issues>.
$tab
# A tibble: 1 × 4
  `@code` `@name` `@level` `@unit`
  <chr>   <chr>   <chr>    <chr>
1 0140    金額    ""       千円

$cat01
# A tibble: 29 × 4
   `@code` `@name`                   `@level` `@parentCode`
   <chr>   <chr>                     <chr>    <chr>
 1 0100    事業総利益                1        <NA>
 2 0110    事業総利益_信用事業収益   2        0100
 3 0200    事業総利益_信用事業費用   2        0100
 4 0330    事業総利益_信用事業総利益 2        0100
 5 0340    事業総利益_共済事業収益   2        0100
 6 0380    事業総利益_共済事業費用   2        0100
 7 0460    事業総利益_共済事業総利益 2        0100
 8 0470    事業総利益_購買事業収益   2        0100
 9 0520    事業総利益_購買事業費用   2        0100
10 0600    事業総利益_購買事業総利益 2        0100
# ℹ 19 more rows

$area
# A tibble: 48 × 4
   `@code` `@name` `@level` `@parentCode`
   <chr>   <chr>   <chr>    <chr>
 1 00000   全国    1        <NA>
 2 01000   北海道  2        00000
 3 02000   青森県  3        01100
 4 03000   岩手県  3        01100
 5 04000   宮城県  3        01100
 6 05000   秋田県  3        01100
 7 06000   山形県  3        01100
 8 07000   福島県  3        01100
 9 08000   茨城県  3        07100
10 09000   栃木県  3        07100
# ℹ 38 more rows

$time
# A tibble: 14 × 3
   `@code`    `@name` `@level`
   <chr>      <chr>   <chr>
 1 2006000000 2006年  1
 2 2005000000 2005年  1
 3 2004000000 2004年  1
 4 2003000000 2003年  1
 5 2002000000 2002年  1
 6 2001000000 2001年  1
 7 2000000000 2000年  1
 8 1999000000 1999年  1
 9 1998000000 1998年  1
10 1997000000 1997年  1
11 1996000000 1996年  1
12 1995000000 1995年  1
13 1994000000 1994年  1
14 1993000000 1993年  1

$.names
# A tibble: 4 × 2
  id    name
  <chr> <chr>
1 tab   表章項目
2 cat01 損益計算書(総括)
3 area  都道府県
4 time  時間軸(年次)
# 統計データ取得 <- estat_getStatsData (appId = appId,statsDataId = statsDataId
Fetching record 1-19485... (total: 19485 records)
# A tibble: 19,485 × 11
   tab_code 表章項目 cat01_code `損益計算書(総括)` area_code 都道府県
   <chr>    <chr>    <chr>      <chr>                <chr>     <chr>
 1 0140     金額     0100       事業総利益           00000     全国
 2 0140     金額     0100       事業総利益           00000     全国
 3 0140     金額     0100       事業総利益           00000     全国
 4 0140     金額     0100       事業総利益           00000     全国
 5 0140     金額     0100       事業総利益           00000     全国
 6 0140     金額     0100       事業総利益           00000     全国
 7 0140     金額     0100       事業総利益           00000     全国
 8 0140     金額     0100       事業総利益           00000     全国
 9 0140     金額     0100       事業総利益           00000     全国
10 0140     金額     0100       事業総利益           00000     全国
# ℹ 19,475 more rows
# ℹ 5 more variables: time_code <chr>, `時間軸(年次)` <chr>, unit <chr>,
#   value <dbl>, annotation <chr>
$ ` 時間軸(年次) ` <- as.double (sub ("年" , "" , df$ ` 時間軸(年次) ` ))$ value <- as.double (sub ("…" , "" , df$ value))$ ` 損益計算書(総括) ` <- factor (df$ ` 損益計算書(総括) ` , levels = unique (df$ ` 損益計算書(総括) ` ))levels (df$ ` 損益計算書(総括) ` ) <- sub ("^事業総利益_" , "" , levels (df$ ` 損益計算書(総括) ` ))unique (df$ ` 損益計算書(総括) ` )
 [1] 事業総利益
 [2] 信用事業収益
 [3] 信用事業費用
 [4] 信用事業総利益
 [5] 共済事業収益
 [6] 共済事業費用
 [7] 共済事業総利益
 [8] 購買事業収益
 [9] 購買事業費用
[10] 購買事業総利益
[11] 販売事業収益
[12] 販売事業費用
[13] 販売事業総利益
[14] 農業倉庫事業収益
[15] 農業倉庫事業費用
[16] 農業倉庫事業総利益
[17] その他事業収益
[18] その他事業費用
[19] その他事業総利益
[20] 事業管理費
[21] 事業管理費_人件費
[22] 事業利益(又は事業損失)
[23] 事業外収益
[24] 事業外費用
[25] 経常利益(又は経常損失)
[26] 特別利益
[27] 特別損失
[28] 法人税、住民税及び事業税
[29] 当期未処分剰余金(当期未処理損失金差引)
29 Levels: 事業総利益 信用事業収益 信用事業費用 信用事業総利益 ... 当期未処分剰余金(当期未処理損失金差引)
$ ` 損益計算書(総括) ` <- gsub ("事業総利益_" , "" , df$ ` 損益計算書(総括) ` )
全国の折れ線グラフ
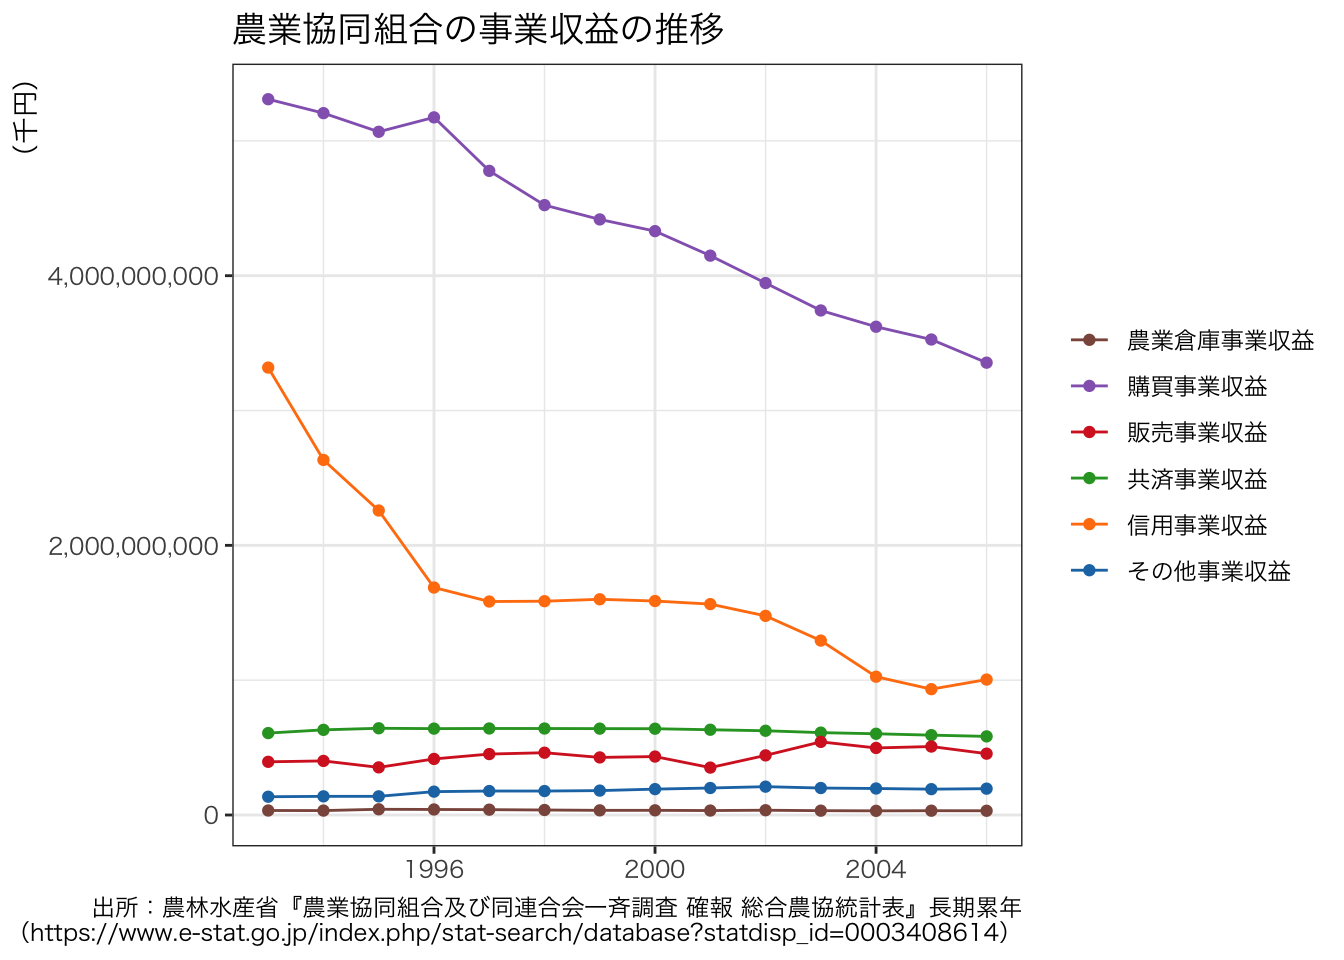
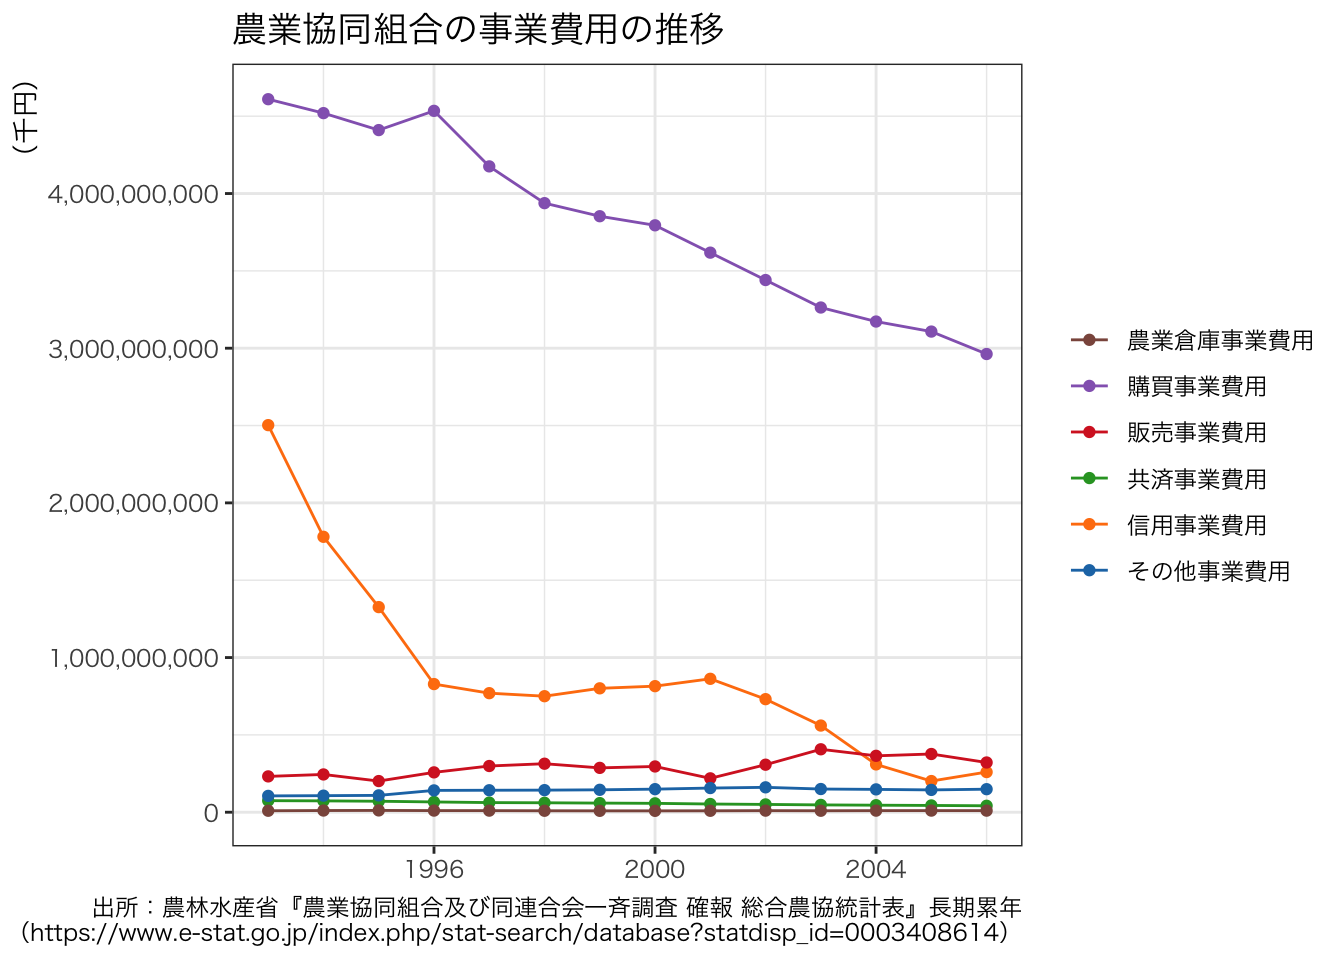
<- df[df$ ` 都道府県 ` == "全国" , ]<- df_all[grep (".事業総利益$" , df_all$ ` 損益計算書(総括) ` ), ]<- ggplot (data = df_all2, aes (x = ` 時間軸(年次) ` , y = value, colour = ` 損益計算書(総括) ` )) + geom_line () + geom_point () + scale_y_continuous (labels = scales:: comma_format (), name = "(千円)" ) + scale_color_d3 () + guides (colour = guide_legend (reverse = TRUE )) + labs (title = "農業協同組合の事業総利益の推移" ,caption = "出所:農林水産省『農業協同組合及び同連合会一斉調査 確報 総合農協統計表』長期累年 \n (https://www.e-stat.go.jp/index.php/stat-search/database?statdisp_id=0003408614)" + theme_bw () + theme (legend.title = element_blank (),axis.title.x = element_blank (),axis.title.y = element_text (size = 10 , hjust = 1 )+ theme (text = element_text (family = "HiraKakuProN-W3" ))ggsave (file = "benefits_by_division_for_each_year_all.pdf" , plot = p, path = outdir, width = 8 , height = 4 )<- df_all[grep ("事業収益$" , df_all$ ` 損益計算書(総括) ` ), ]<- ggplot (data = df_all2, aes (x = ` 時間軸(年次) ` , y = value, colour = ` 損益計算書(総括) ` )) + geom_line () + geom_point () + scale_y_continuous (labels = scales:: comma_format (), name = "(千円)" ) + scale_color_d3 () + guides (colour = guide_legend (reverse = TRUE )) + labs (title = "農業協同組合の事業収益の推移" ,caption = "出所:農林水産省『農業協同組合及び同連合会一斉調査 確報 総合農協統計表』長期累年 \n (https://www.e-stat.go.jp/index.php/stat-search/database?statdisp_id=0003408614)" + theme_bw () + theme (legend.title = element_blank (),axis.title.x = element_blank (),axis.title.y = element_text (size = 10 , hjust = 1 )+ theme (text = element_text (family = "HiraKakuProN-W3" ))ggsave (file = "revenues_by_division_for_each_year_all.pdf" , plot = p, path = outdir, width = 8 , height = 4 )<- df_all[grep ("事業費用$" , df_all$ ` 損益計算書(総括) ` ), ]<- ggplot (data = df_all2, aes (x = ` 時間軸(年次) ` , y = value, colour = ` 損益計算書(総括) ` )) + geom_line () + geom_point () + scale_y_continuous (labels = scales:: comma_format (), name = "(千円)" ) + scale_color_d3 () + guides (colour = guide_legend (reverse = TRUE )) + labs (title = "農業協同組合の事業費用の推移" ,caption = "出所:農林水産省『農業協同組合及び同連合会一斉調査 確報 総合農協統計表』長期累年 \n (https://www.e-stat.go.jp/index.php/stat-search/database?statdisp_id=0003408614)" + theme_bw () + theme (legend.title = element_blank (),axis.title.x = element_blank (),axis.title.y = element_text (size = 10 , hjust = 1 )+ theme (text = element_text (family = "HiraKakuProN-W3" ))ggsave (file = "costs_by_division_for_each_year_all.pdf" , plot = p, path = outdir, width = 8 , height = 4 )
都道府県別の折れ線グラフ
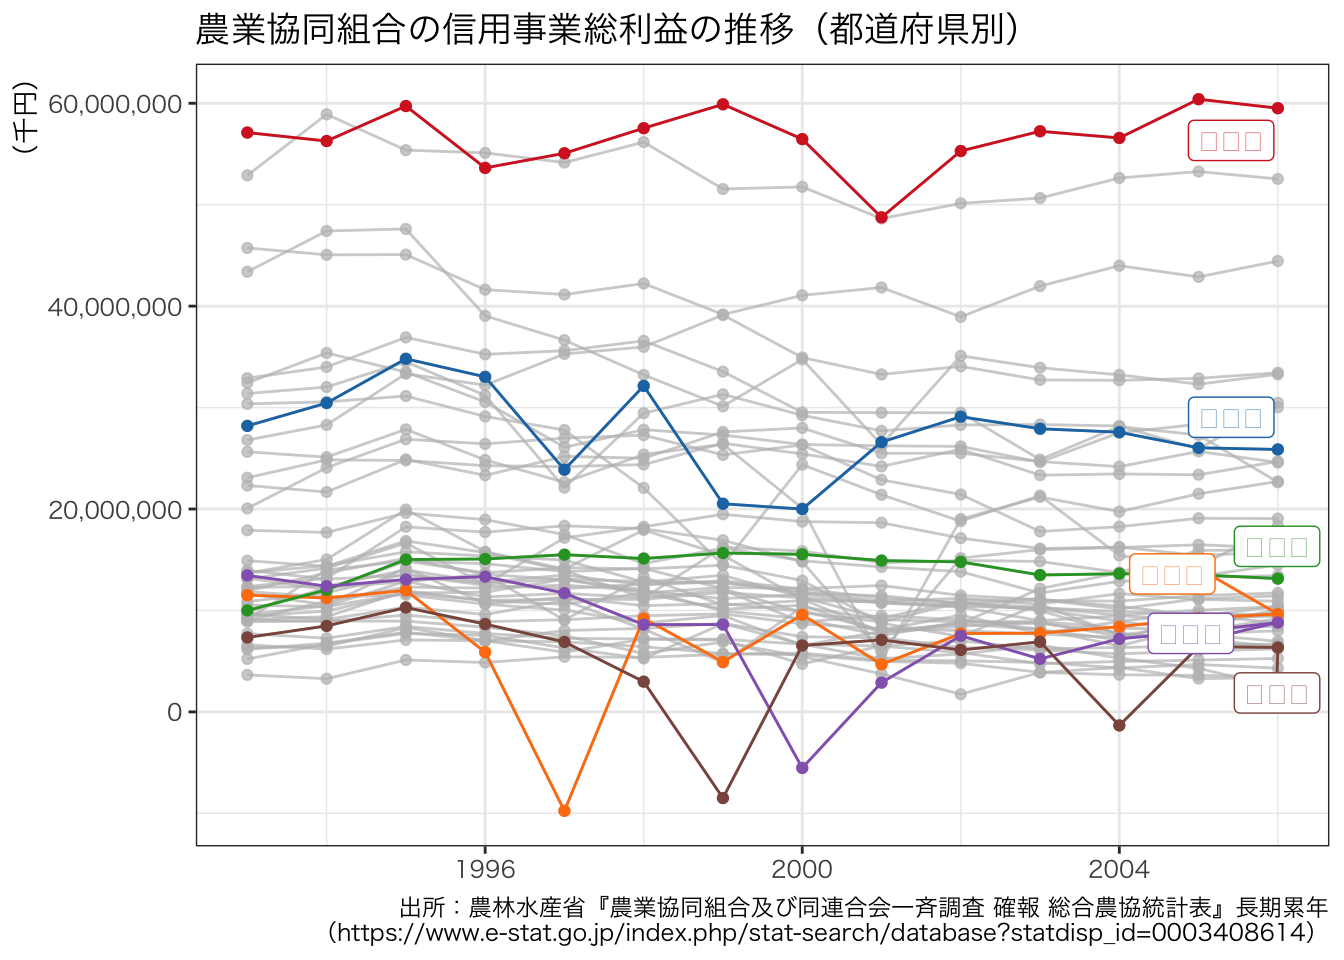
library (dplyr)library (gghighlight)<- df |> filter (!= "全国" ,grepl ("信用事業総利益" , ` 損益計算書(総括) ` )<- ggplot (data = df_pref, aes (x = ` 時間軸(年次) ` , y = value, colour = ` 都道府県 ` )) + geom_line () + geom_point () + gghighlight (grepl ("愛媛県|北海道|愛知県|奈良県|沖縄県|長崎県" , 都道府県)) + scale_y_continuous (labels = scales:: comma_format (), name = "(千円)" ) + scale_color_d3 () + labs (title = "農業協同組合の信用事業総利益の推移(都道府県別)" ,caption = "出所:農林水産省『農業協同組合及び同連合会一斉調査 確報 総合農協統計表』長期累年 \n (https://www.e-stat.go.jp/index.php/stat-search/database?statdisp_id=0003408614)" + theme_bw () + theme (legend.title = element_blank (),axis.title.x = element_blank (),axis.title.y = element_text (size = 10 , hjust = 1 )
Warning: Tried to calculate with group_by(), but the calculation failed.
Falling back to ungrouped filter operation...
Tried to calculate with group_by(), but the calculation failed.
Falling back to ungrouped filter operation...
+ theme (text = element_text (family = "HiraKakuProN-W3" ))ggsave (file = "benefits_by_division_for_each_year_pref_shinyou.pdf" , plot = p, path = outdir, width = 8 , height = 4 )
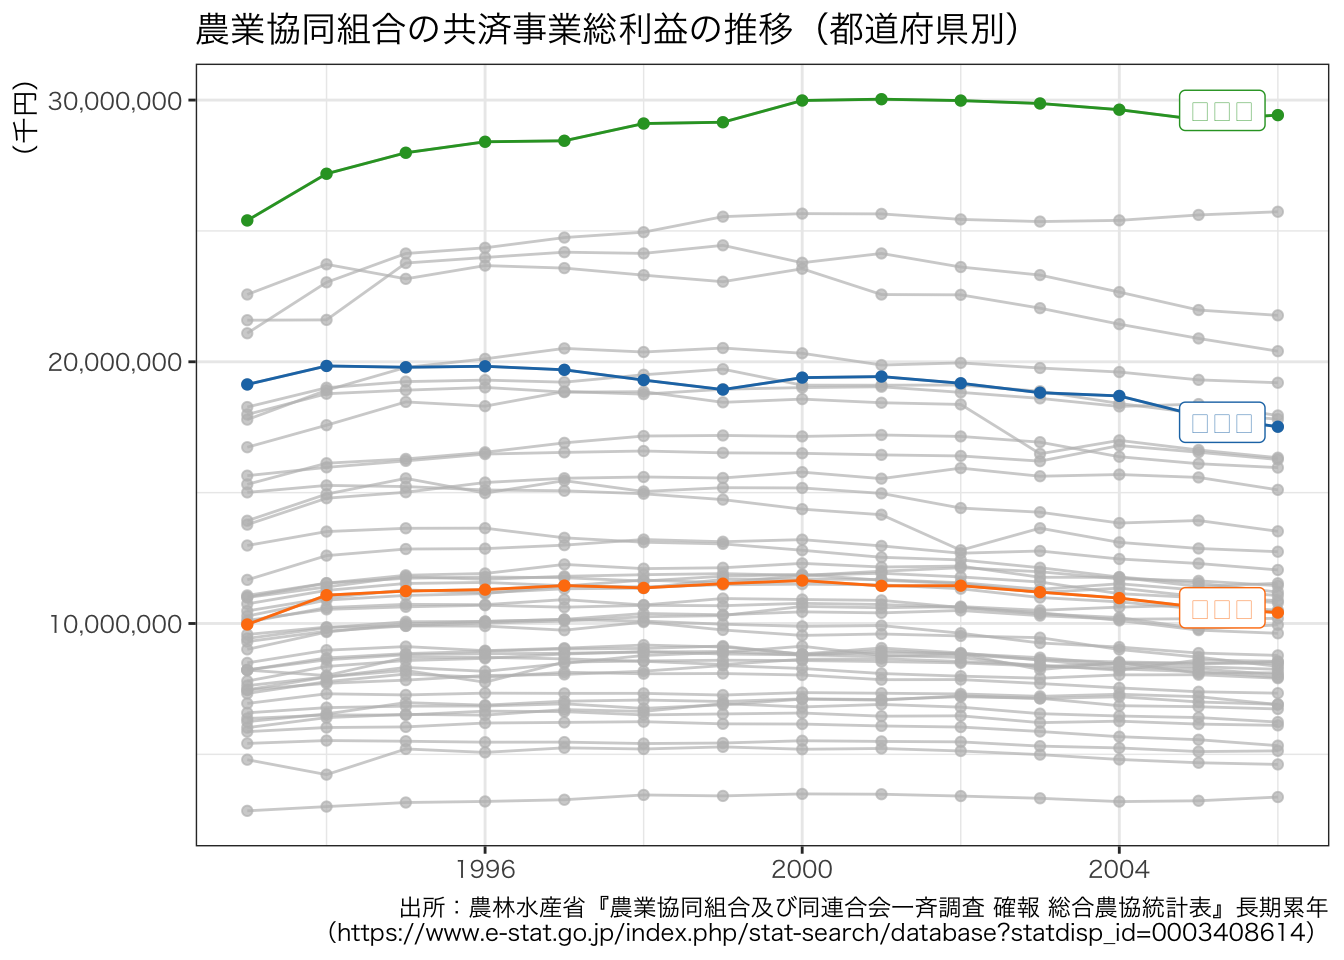
<- df |> filter (!= "全国" ,grepl ("共済事業総利益" , ` 損益計算書(総括) ` )<- ggplot (data = df_pref, aes (x = ` 時間軸(年次) ` , y = value, colour = ` 都道府県 ` )) + geom_line () + geom_point () + gghighlight (grepl ("愛媛県|北海道|愛知県" , 都道府県)) + scale_y_continuous (labels = scales:: comma_format (), name = "(千円)" ) + scale_color_d3 () + labs (title = "農業協同組合の共済事業総利益の推移(都道府県別)" ,caption = "出所:農林水産省『農業協同組合及び同連合会一斉調査 確報 総合農協統計表』長期累年 \n (https://www.e-stat.go.jp/index.php/stat-search/database?statdisp_id=0003408614)" + theme_bw () + theme (legend.title = element_blank (),axis.title.x = element_blank (),axis.title.y = element_text (size = 10 , hjust = 1 )
Warning: Tried to calculate with group_by(), but the calculation failed.
Falling back to ungrouped filter operation...
Tried to calculate with group_by(), but the calculation failed.
Falling back to ungrouped filter operation...
+ theme (text = element_text (family = "HiraKakuProN-W3" ))ggsave (file = "benefits_by_division_for_each_year_pref_kyousai.pdf" , plot = p, path = outdir, width = 8 , height = 4 )
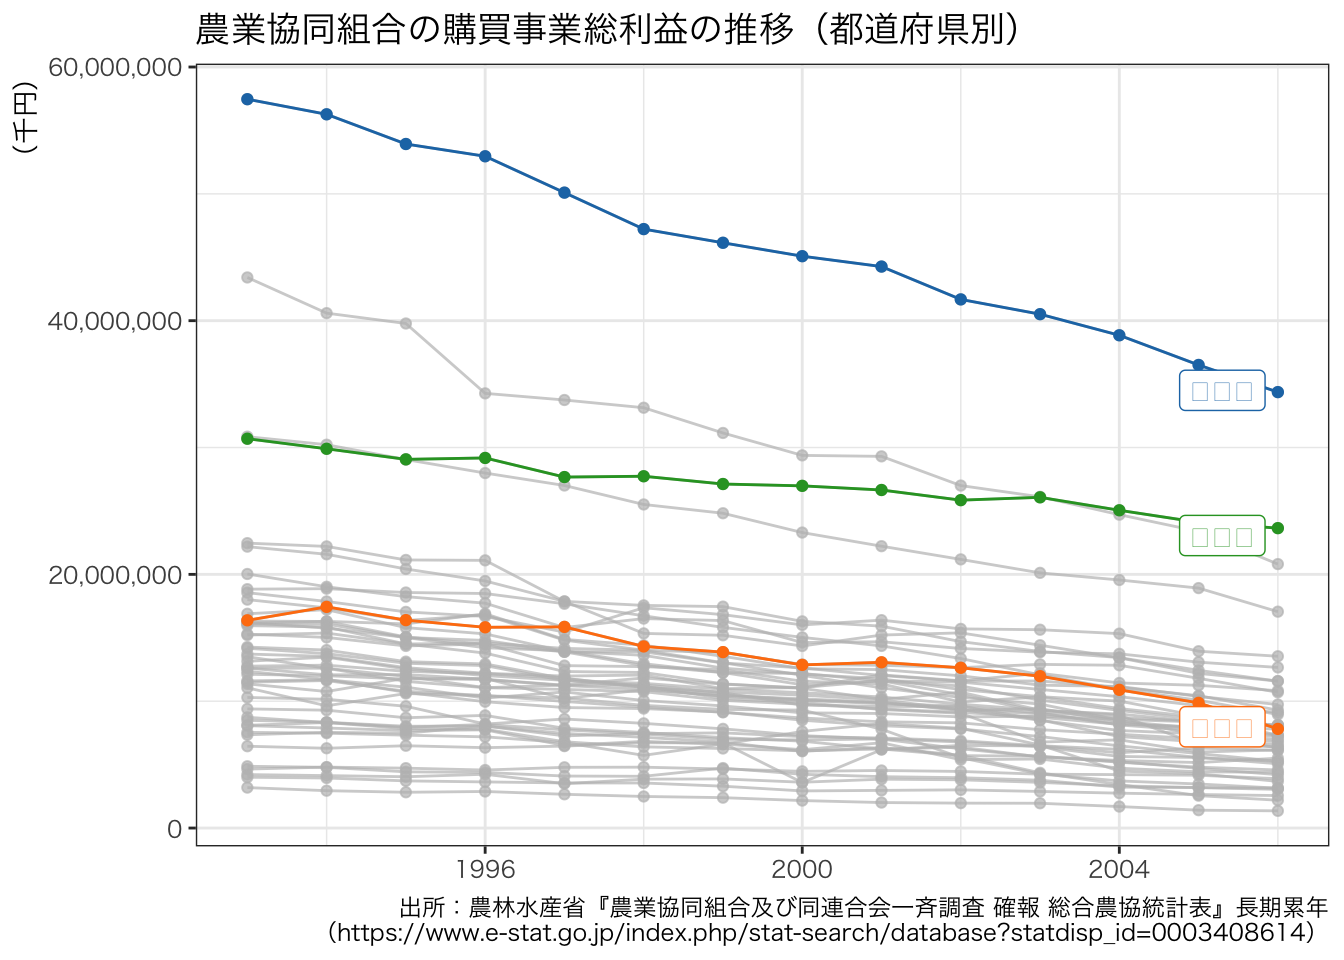
<- df |> filter (!= "全国" ,grepl ("購買事業総利益" , ` 損益計算書(総括) ` )<- ggplot (data = df_pref, aes (x = ` 時間軸(年次) ` , y = value, colour = ` 都道府県 ` )) + geom_line () + geom_point () + gghighlight (grepl ("愛媛県|北海道|愛知県" , 都道府県)) + scale_y_continuous (labels = scales:: comma_format (), name = "(千円)" ) + scale_color_d3 () + labs (title = "農業協同組合の購買事業総利益の推移(都道府県別)" ,caption = "出所:農林水産省『農業協同組合及び同連合会一斉調査 確報 総合農協統計表』長期累年 \n (https://www.e-stat.go.jp/index.php/stat-search/database?statdisp_id=0003408614)" + theme_bw () + theme (legend.title = element_blank (),axis.title.x = element_blank (),axis.title.y = element_text (size = 10 , hjust = 1 )
Warning: Tried to calculate with group_by(), but the calculation failed.
Falling back to ungrouped filter operation...
Tried to calculate with group_by(), but the calculation failed.
Falling back to ungrouped filter operation...
+ theme (text = element_text (family = "HiraKakuProN-W3" ))ggsave (file = "benefits_by_division_for_each_year_pref_koubai.pdf" , plot = p, path = outdir, width = 8 , height = 4 )
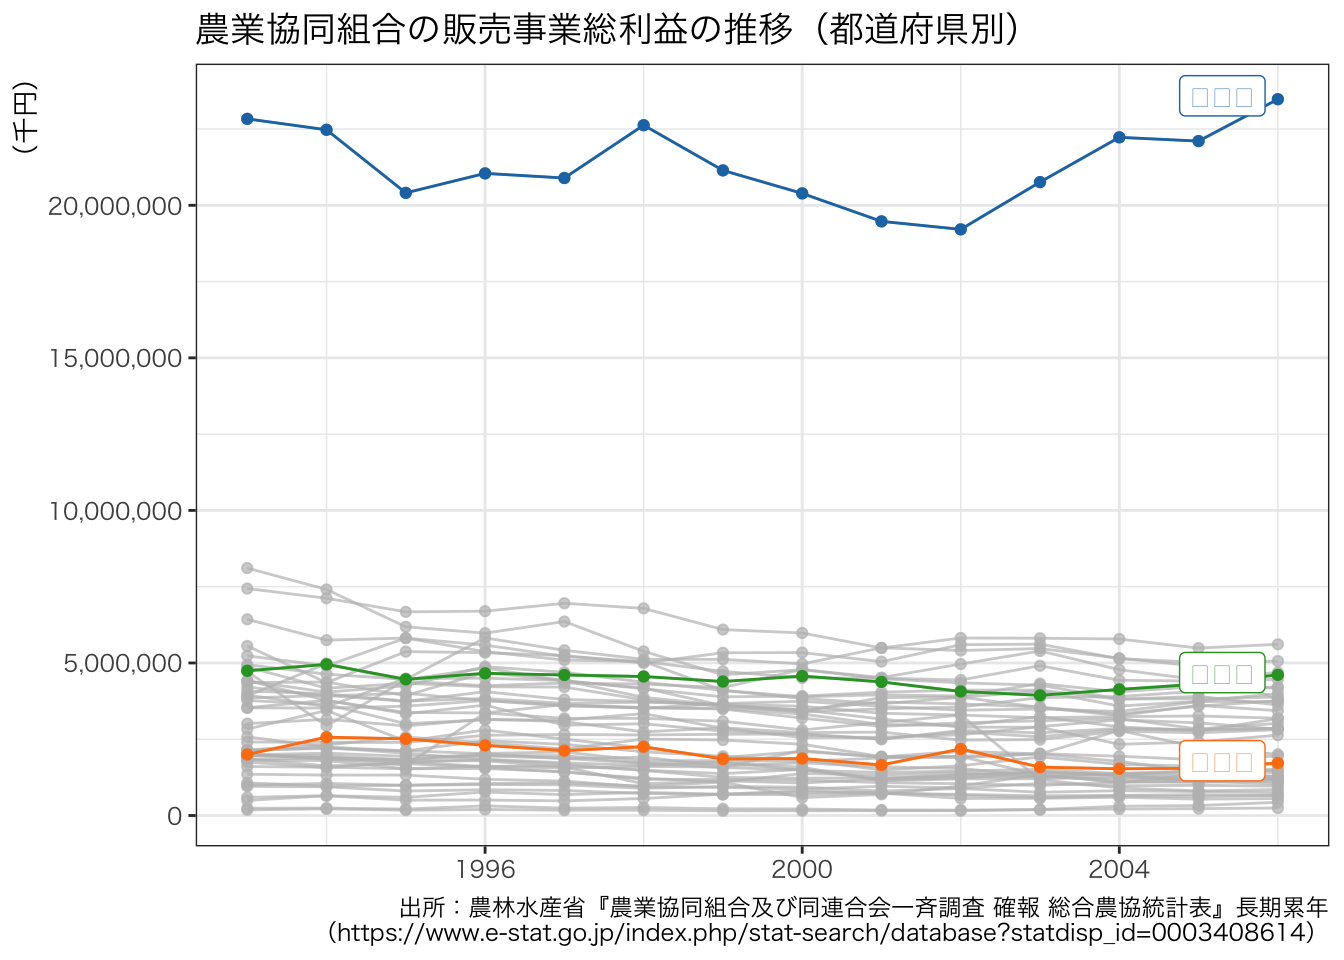
<- df |> filter (!= "全国" ,grepl ("販売事業総利益" , ` 損益計算書(総括) ` )<- ggplot (data = df_pref, aes (x = ` 時間軸(年次) ` , y = value, colour = ` 都道府県 ` )) + geom_line () + geom_point () + gghighlight (grepl ("愛媛県|北海道|愛知県" , 都道府県)) + scale_y_continuous (labels = scales:: comma_format (), name = "(千円)" ) + scale_color_d3 () + labs (title = "農業協同組合の販売事業総利益の推移(都道府県別)" ,caption = "出所:農林水産省『農業協同組合及び同連合会一斉調査 確報 総合農協統計表』長期累年 \n (https://www.e-stat.go.jp/index.php/stat-search/database?statdisp_id=0003408614)" + theme_bw () + theme (legend.title = element_blank (),axis.title.x = element_blank (),axis.title.y = element_text (size = 10 , hjust = 1 )
Warning: Tried to calculate with group_by(), but the calculation failed.
Falling back to ungrouped filter operation...
Tried to calculate with group_by(), but the calculation failed.
Falling back to ungrouped filter operation...
+ theme (text = element_text (family = "HiraKakuProN-W3" ))ggsave (file = "benefits_by_division_for_each_year_pref_hanbai.pdf" , plot = p, path = outdir, width = 8 , height = 4 )